 https://spatialvision.com.au/wp-content/uploads/2024/03/Case-Study-web-tile-5.png
500
900
Jeff D
https://spatialvision.com.au/wp-content/uploads/2020/04/SV_Logo_Inline.png
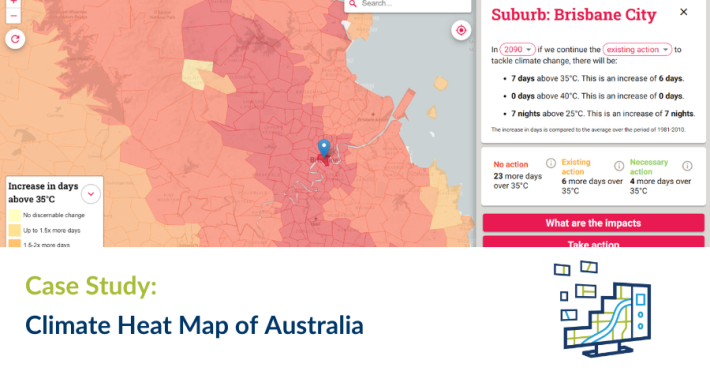
Jeff D2024-03-12 15:06:442024-03-13 09:52:19Case Study: Climate Heat Map of Australia
https://spatialvision.com.au/wp-content/uploads/2024/03/Case-Study-web-tile-5.png
500
900
Jeff D
https://spatialvision.com.au/wp-content/uploads/2020/04/SV_Logo_Inline.png
Jeff D2024-03-12 15:06:442024-03-13 09:52:19Case Study: Climate Heat Map of AustraliaAt Spatial Vision, we live and breathe geospatial and mobile technology.
When you work with us, you’re not just getting our vast experience and technical knowledge – you’re getting a partner who is interested in your business and knows your industry.
Companies and Government departments in Australia and around the world come to us because we help them solve tough business problems with tech-driven solutions that have a human heart.
People have the power to change the world for the better. We put that power in your hands.
Industry-leading solutions for a better tomorrow
We help organisations in all kinds of domains.
With the right tools, analysis and advice, any organisation can unlock the power of its data to solve business challenges and serve its customers better.
WHAT WE’RE TALKING ABOUT
See our latest news, opinions and in-depth studies about the issues affecting you.
https://spatialvision.com.au/wp-content/uploads/2024/03/Case-Study-web-tile-5.png
500
900
Jeff D
https://spatialvision.com.au/wp-content/uploads/2020/04/SV_Logo_Inline.png
Jeff D2024-03-12 15:06:442024-03-13 09:52:19Case Study: Climate Heat Map of Australia https://spatialvision.com.au/wp-content/uploads/2024/02/Case-Study-web-tile-1.png
500
900
Jeff D
https://spatialvision.com.au/wp-content/uploads/2020/04/SV_Logo_Inline.png
Jeff D2024-03-01 01:06:222024-03-01 14:52:32Case Study: Migratory Birds as Connectivity Indicators
https://spatialvision.com.au/wp-content/uploads/2024/02/Case-Study-web-tile-1.png
500
900
Jeff D
https://spatialvision.com.au/wp-content/uploads/2020/04/SV_Logo_Inline.png
Jeff D2024-03-01 01:06:222024-03-01 14:52:32Case Study: Migratory Birds as Connectivity Indicators https://spatialvision.com.au/wp-content/uploads/2024/02/Case-Study-web-tile-3.png
500
900
Jeff D
https://spatialvision.com.au/wp-content/uploads/2020/04/SV_Logo_Inline.png
Jeff D2024-02-15 13:48:392024-02-15 13:48:39Case Study: Melbourne Metropolitan Open Space 30–Year Investment Opportunities Framework
https://spatialvision.com.au/wp-content/uploads/2024/02/Case-Study-web-tile-3.png
500
900
Jeff D
https://spatialvision.com.au/wp-content/uploads/2020/04/SV_Logo_Inline.png
Jeff D2024-02-15 13:48:392024-02-15 13:48:39Case Study: Melbourne Metropolitan Open Space 30–Year Investment Opportunities Framework https://spatialvision.com.au/wp-content/uploads/2024/02/Blog-post-tile-1.png
500
900
Jeff D
https://spatialvision.com.au/wp-content/uploads/2020/04/SV_Logo_Inline.png
Jeff D2024-02-12 10:28:272024-02-15 14:54:16Shaping Fiji’s Future Geospatial Capability
https://spatialvision.com.au/wp-content/uploads/2024/02/Blog-post-tile-1.png
500
900
Jeff D
https://spatialvision.com.au/wp-content/uploads/2020/04/SV_Logo_Inline.png
Jeff D2024-02-12 10:28:272024-02-15 14:54:16Shaping Fiji’s Future Geospatial CapabilityOUR CUSTOMERS DESCRIBE US IN THREE WORDS AS…
“Innovative, Intelligent, Efficient” “Responsive, Supportive and Customer-Focused” “Knowledgeable, Supportive and Approachable” “Reliable, Dependable and Quality” “Knowledgeable, Trusted and Reasonable" “Professional, Responsive and Detailed” “Professional, Efficient and Knowledgeable”

We don’t work for you. We work with you.
Good solutions are part tech, part people.
Our work is always backed with a strong level of service—from scoping through to implementation, hosting and training.
LATEST NEWS
 Geospatial Trends in the Water IndustryApril 16, 2024 - 1:52 pm
 Spatial Vision launches geospatial climate groupMarch 15, 2024 - 8:08 am
 Case Study: Climate Heat Map of AustraliaMarch 12, 2024 - 3:06 pm
 Case Study: Migratory Birds as Connectivity IndicatorsMarch 1, 2024 - 1:06 am
FOLLOW US
![]()
![]()
![]()